Australia's Housing Crisis: When Population Growth Outpaces Supply.
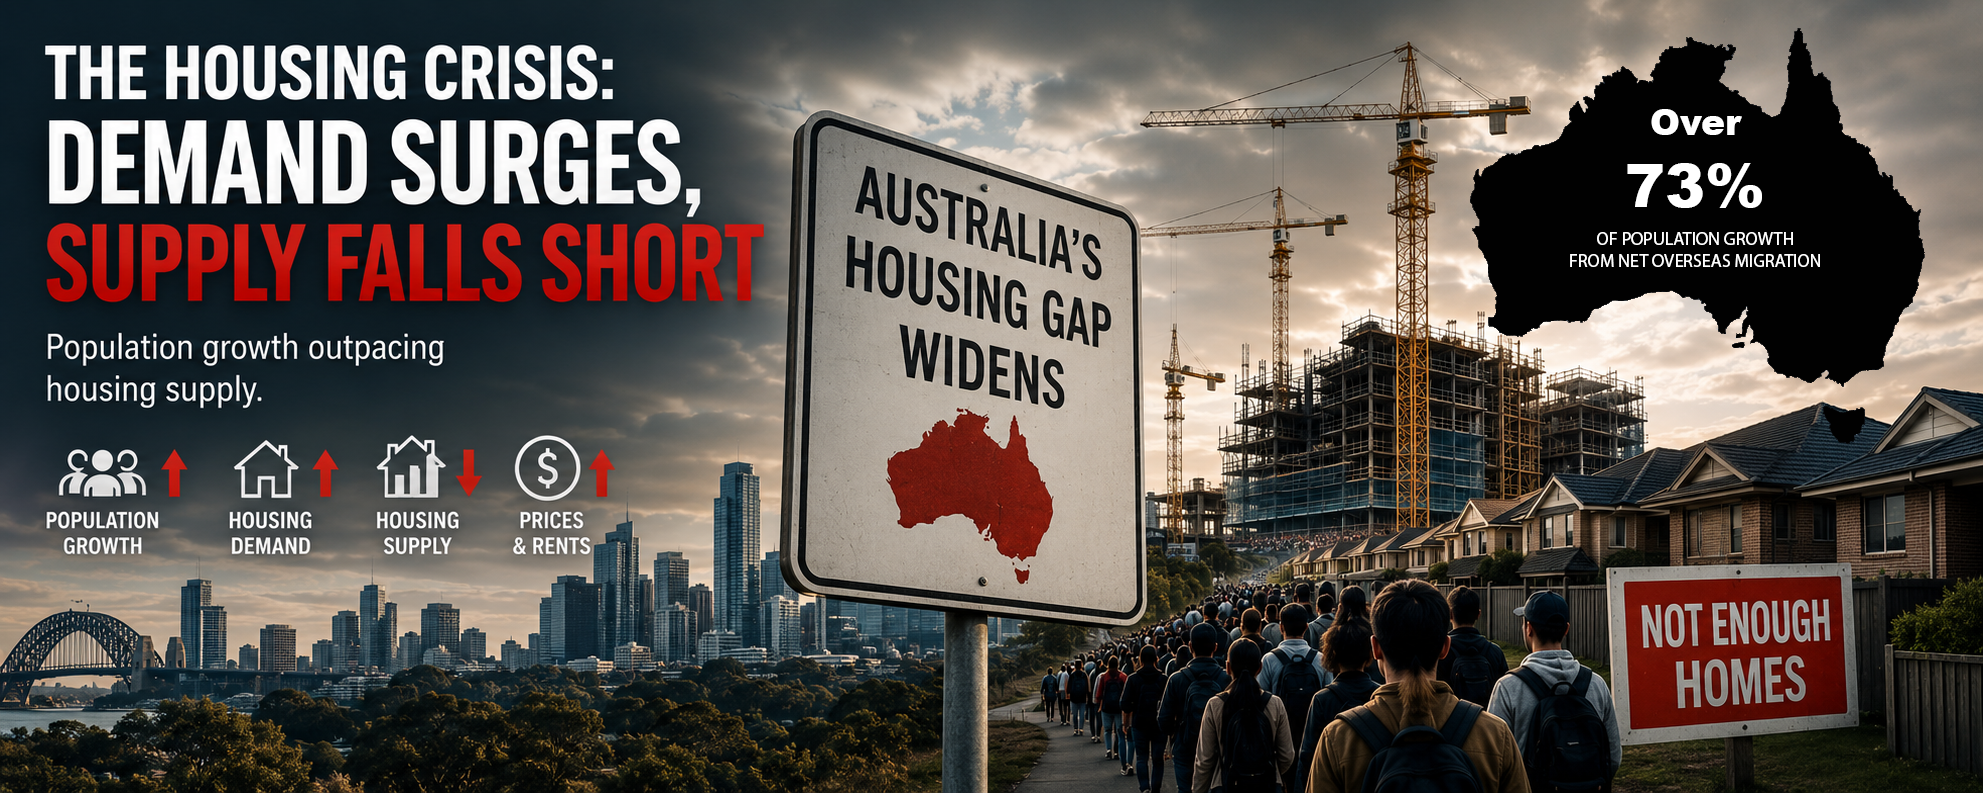
Australia's housing affordability crisis is often debated, but data from the Australian Bureau of Statistics (ABS) helps clarify the pressures driving it. Over the past five years, population growth, fuelled overwhelmingly by net overseas migration, has added more than two million people, while housing construction has struggled to keep pace.
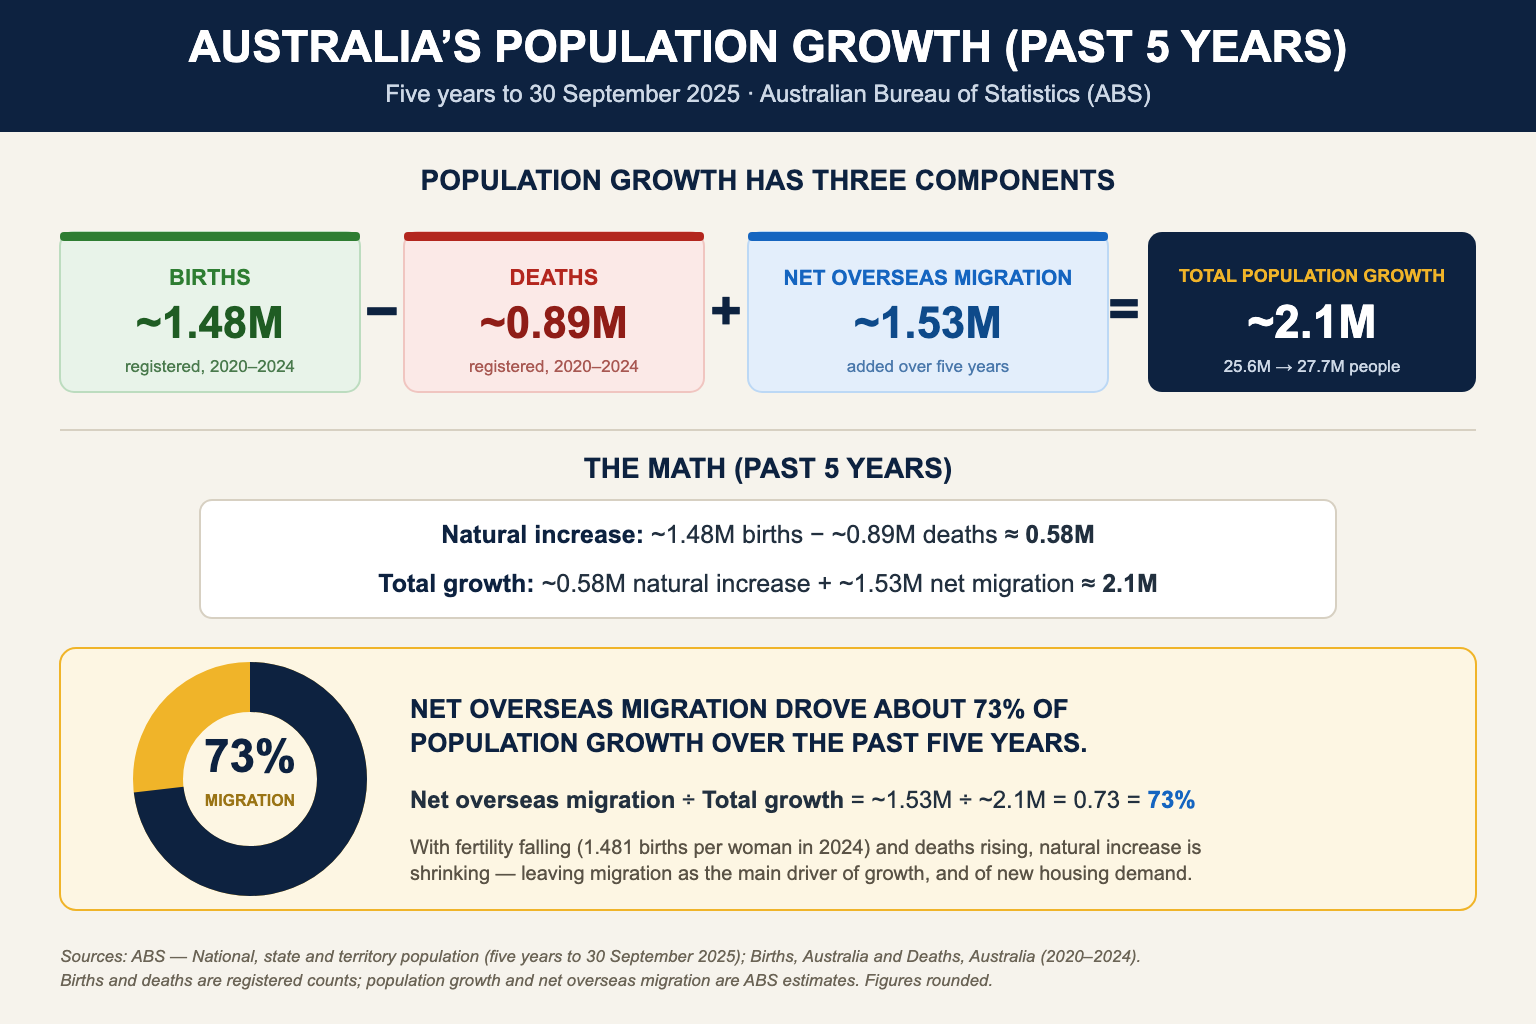
According to the ABS National, state and territory population release, Australia's population reached 27,724,744 people at 30 September 2025, up from around 25.6 million five years earlier. That is an increase of approximately 2.1 million people over the five years to 30 September 2025. [1]
That growth came from two sources. Natural increase, the number of births minus deaths, added roughly 0.58 million people, while net overseas migration added about 1.53 million. In other words, net overseas migration accounted for roughly 73 percent of Australia's population growth over the past five years. [1]
The components behind natural increase tell their own story. Across the 2020 to 2024 calendar years, the ABS recorded approximately 1.48 million registered births and 0.89 million registered deaths. [2][3] Births have been broadly flat to falling: the total fertility rate slipped from 1.696 in 2021 to 1.481 in 2024, well below the replacement level of about 2.1 and among the lowest rates on record. [2] Deaths, by contrast, have risen as the population ages, climbing from 161,300 in 2020 to 187,268 in 2024. [3] With natural increase shrinking, net overseas migration has become the dominant driver of growth, and the primary source of new housing demand.
The pattern has held into the most recent year. In the year to 30 September 2025, the population grew by 423,600 people (1.6 percent), of which net overseas migration contributed 311,000, again about 73 percent of total growth. That migration figure reflects approximately 572,000 arrivals against 261,000 departures. [1]
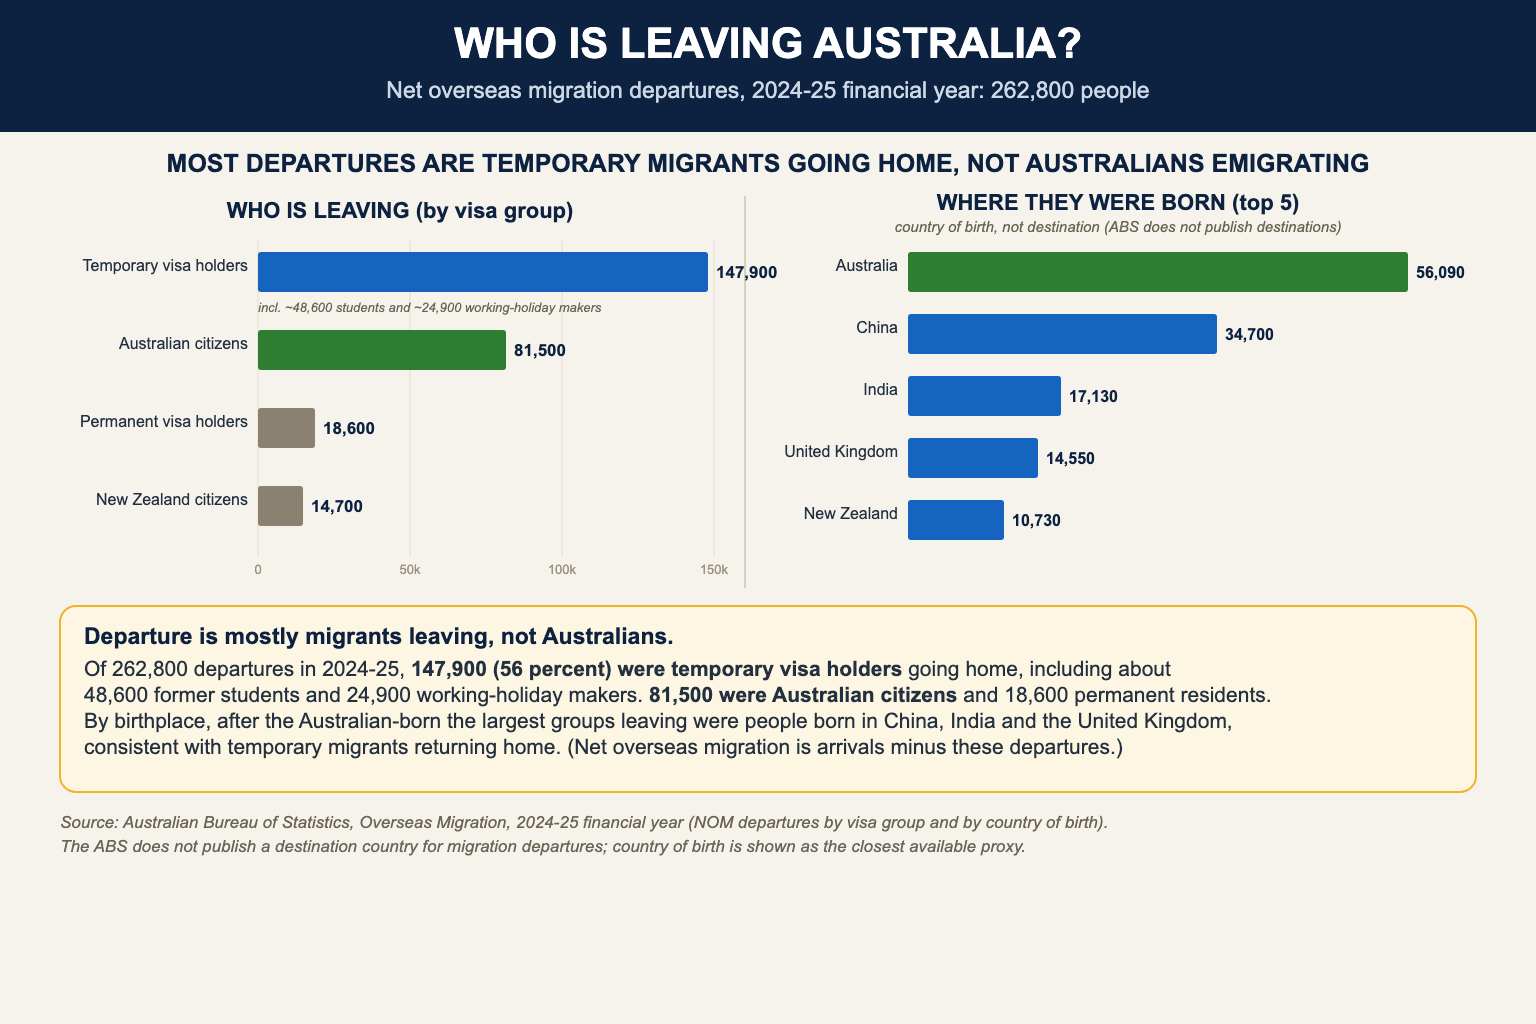
Those departures repay a closer look, because migration is not a one-way flow. In the 2024-25 financial year some 262,800 people left Australia long-term. About 147,900 of them, 56 percent, were temporary visa holders going home, including roughly 48,600 former students and 24,900 working holiday makers; a further 81,500 were Australian citizens emigrating and 18,600 were departing permanent residents. The Australian Bureau of Statistics does not record where they go, but after the Australian-born the largest groups leaving were people born in China, India and the United Kingdom, consistent with former students returning home. Net overseas migration is simply what remains once these departures are subtracted from arrivals. [25]
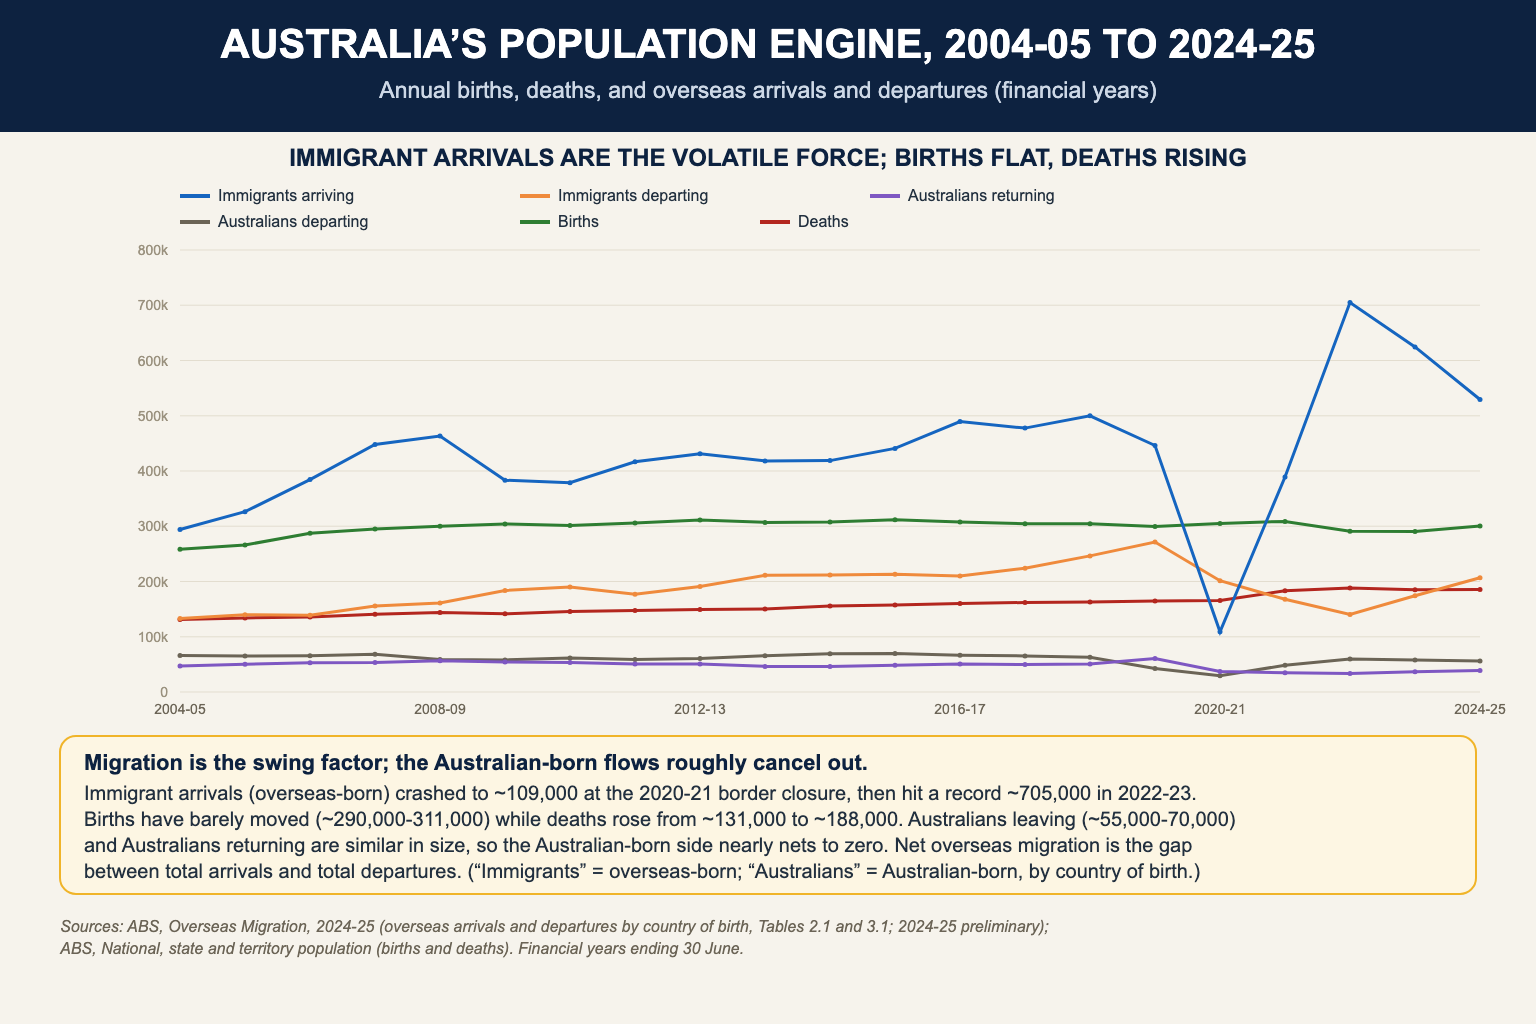
Stepping back over two decades makes the dynamics plain. Across the financial years from 2004-05 to 2024-25, immigrant arrivals have been by far the most volatile force in the population, collapsing to about 109,000 when the border closed in 2020-21 and then rebounding to a record of roughly 705,000 in 2022-23. Births, by contrast, have barely shifted, holding between about 290,000 and 311,000 a year, while deaths have risen steadily with the ageing population, from around 131,000 to 186,000. The flows of Australian-born people in and out of the country are smaller and roughly cancel each other, with departures often modestly exceeding returns. What remains, once the steadier currents of birth, death and citizen movement are accounted for, is a population increasingly shaped by the rise and fall of overseas arrivals. [1][25]
Translating population growth into housing demand depends on how many people occupy each dwelling. Using an average household size of around 2.5 people per dwelling, broadly consistent with the most recent Census, [4] the past five years growth of about 2.1 million people implies underlying demand for roughly 835,000 additional homes, around 167,000 a year. Net overseas migration alone accounts for about 610,000 of those.
These figures reflect population growth alone. They take no account of the way Australians themselves are forming smaller and more numerous households, which pushes the required number of dwellings higher still, a point examined further below.
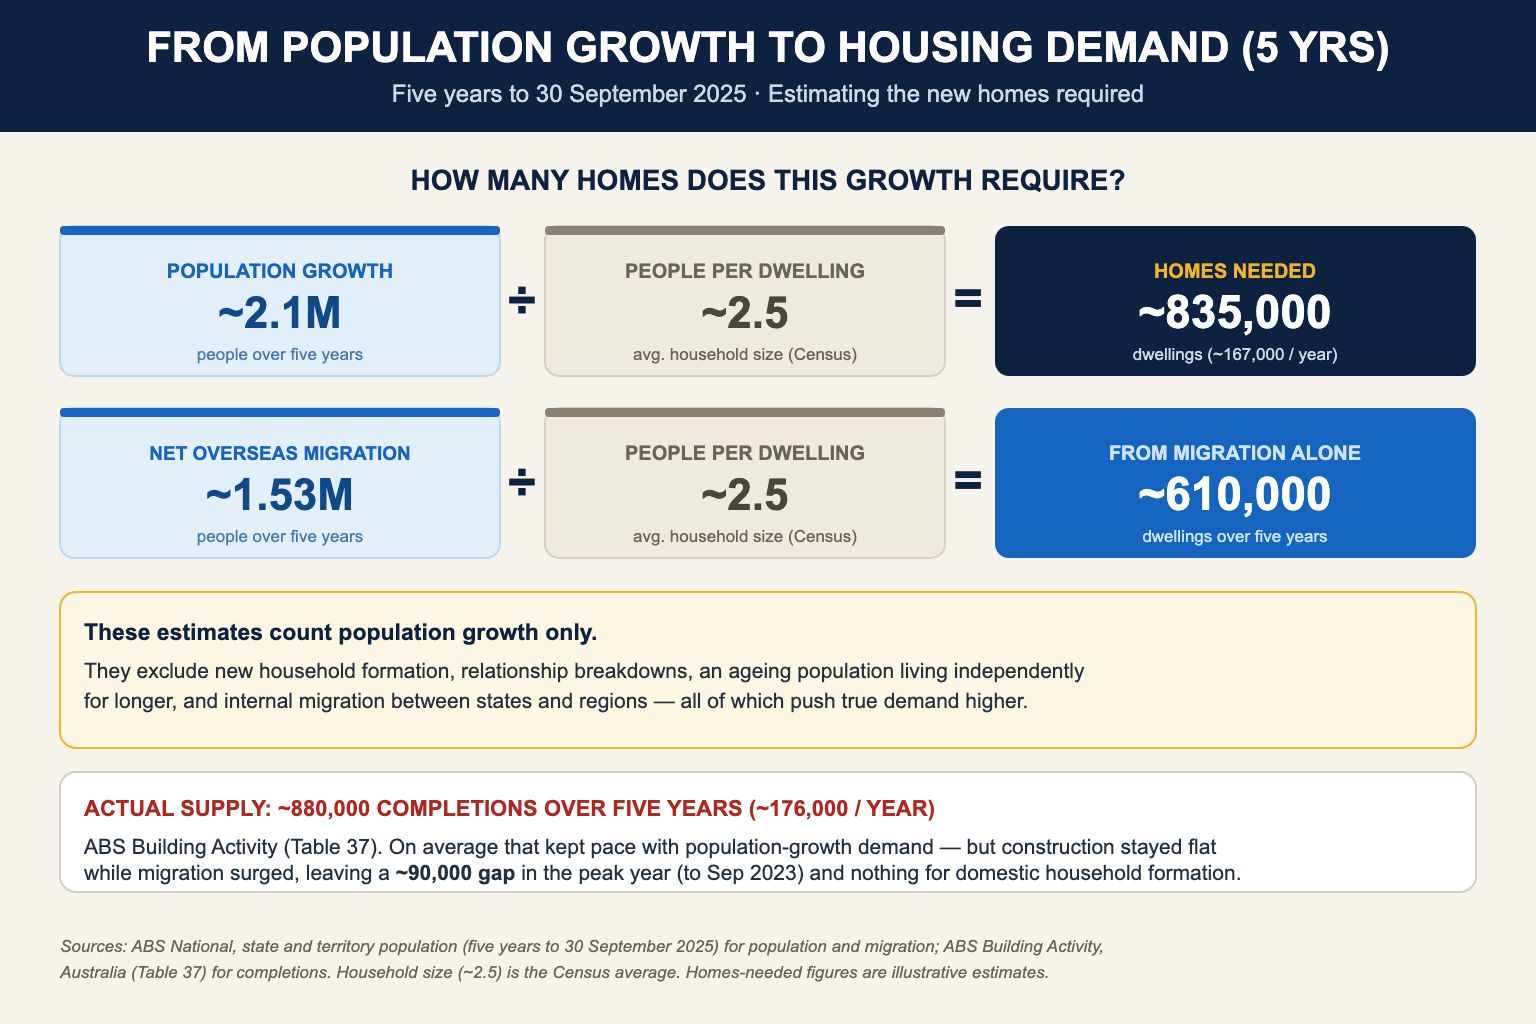
On the supply side, the picture is more nuanced than a simple shortfall. The population, births and deaths releases above measure people rather than dwellings; separate ABS Building Activity data (Table 37, dwelling unit completions) show approximately 880,000 dwellings were completed over the five years to 30 September 2025, an average of about 176,000 a year. That figure barely moved across the period, from 179,923 completions in 2020-21 to 174,981 in 2024-25, and it is broadly in line with the roughly 835,000 homes needed to house population growth alone. [5]
Two things complicate that reassuring average, however. First, it leaves nothing for the additional demand created by domestic household formation, relationship breakdowns, an ageing population living independently for longer, and the gradual decline in average household size, all of which require extra dwellings beyond those needed for population growth. Second, the five-year average masks a sharp timing mismatch: construction stayed flat while migration surged. In the year to 30 September 2023 alone, population growth of 661,800 people implied demand for roughly 265,000 homes, against about 174,000 completed in 2022-23, a single-year gap of around 90,000 dwellings. [1][5] It was this collision of record migration with stagnant construction, rather than a steady five-year shortfall, that drove the recent squeeze.
Such pressures have significant consequences. When demand consistently runs close to or above supply, competition for housing intensifies. Prospective home buyers face rising prices, renters face increasing rents, and vacancy rates remain persistently low. This relationship between supply constraints and housing costs has been repeatedly highlighted in Reserve Bank of Australia commentary on the housing market. [6]
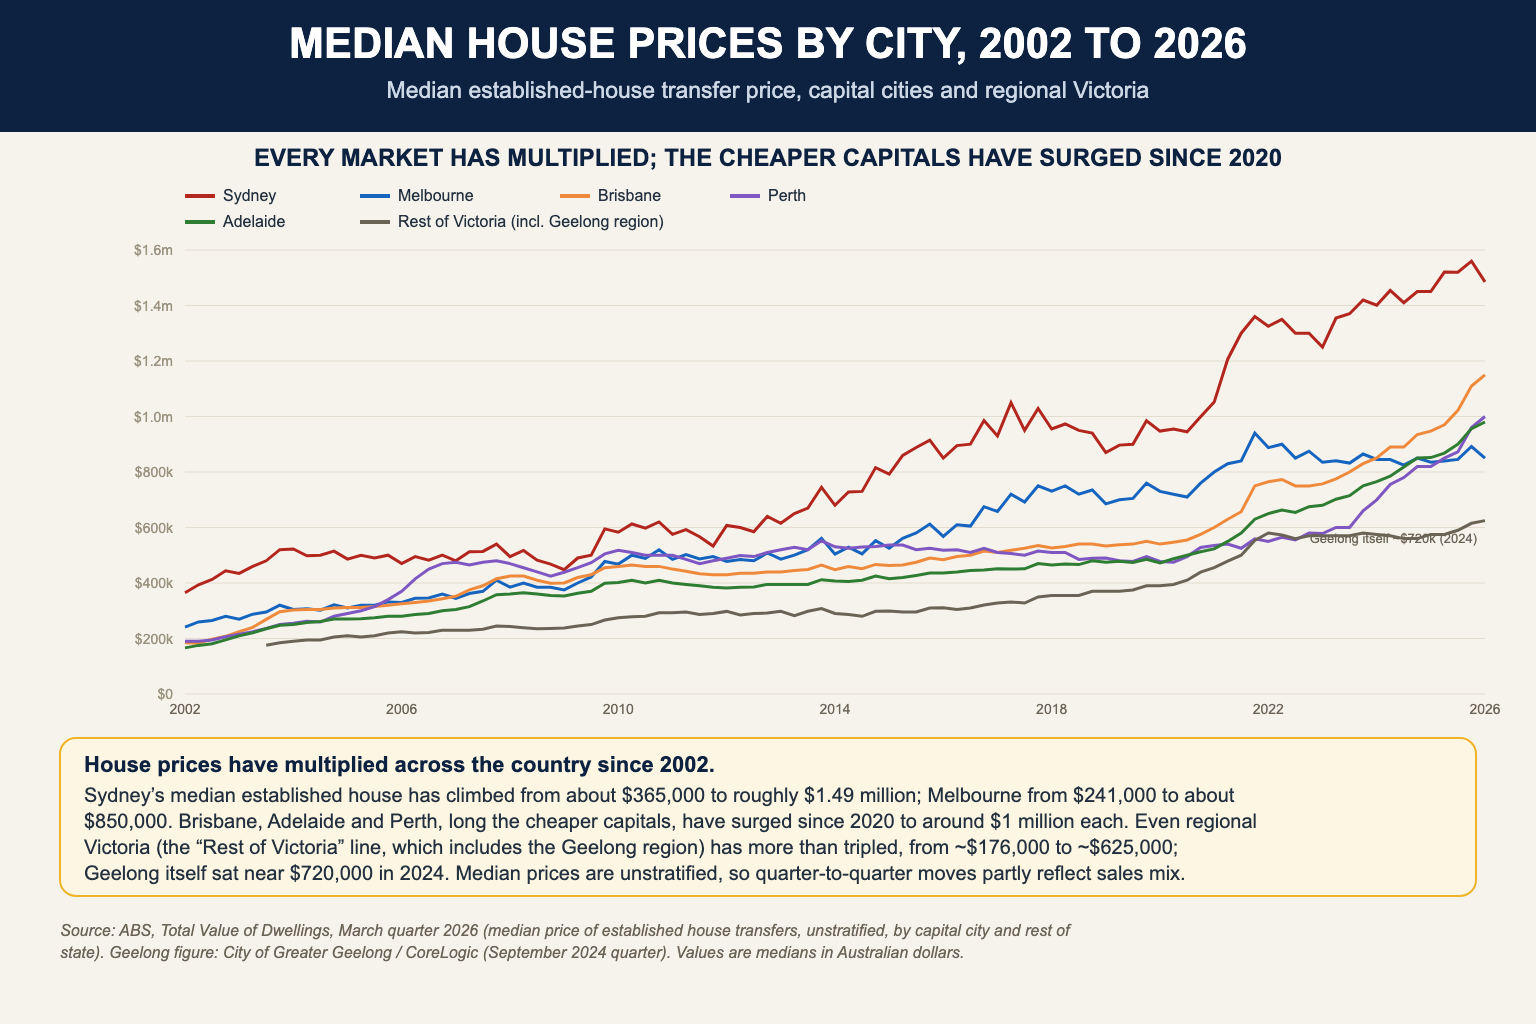
The result is visible in prices. Median established-house prices have multiplied across every market since 2002: in Sydney from about $365,000 to roughly $1.49 million, in Melbourne from $241,000 to about $850,000, and in the once-cheaper capitals of Brisbane, Adelaide and Perth to around $1 million each after a sharp run-up since 2020. The pressure is not confined to the capitals; in regional Victoria, which includes the Geelong area, the median has more than tripled to about $625,000, with Geelong itself near $720,000 by 2024. Set against incomes that have grown far more slowly, these are the numbers that turn population pressure into an affordability crisis. [26][27]
None of this suggests that Australia should abandon immigration. Migration has long played an important role in Australia's economic growth and development. However, the data raises legitimate questions about whether current migration levels are aligned with the nation's ability to deliver the housing, infrastructure, and services required to support a rapidly growing population.
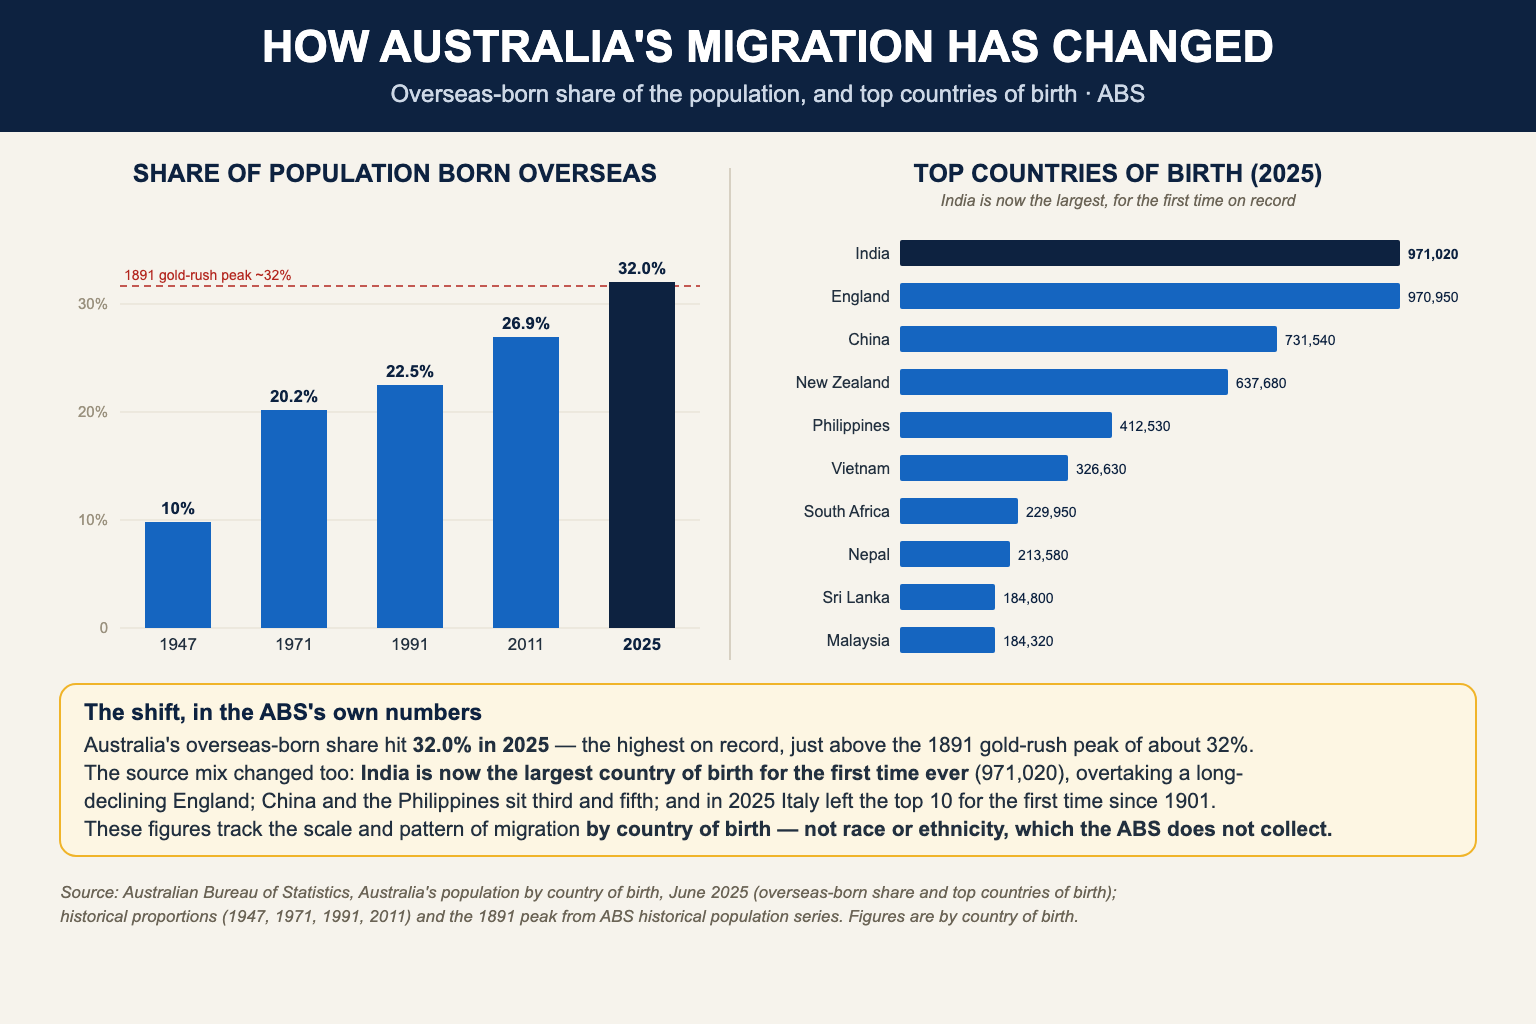
The scale and composition of that intake have both shifted markedly. As at 30 June 2025 (the latest country-of-birth benchmark, three months before the 30 September 2025 population total cited earlier), 32.0 percent of Australia's population, around 8.8 million people, was born overseas, the highest share on record and just above the 31.7 percent reached at the 1891 gold-rush census. The mix of origins has changed too: for the first time on record, India is the largest country of birth (971,020), having overtaken a long-declining England (970,950), with China (731,540), New Zealand and the Philippines next, while in the same year Italy fell out of the top ten countries of birth for the first time since 1901. These are country-of-birth figures rather than measures of ancestry or ethnicity, which the ABS does not collect, but they show a migration program once dominated by the United Kingdom and Europe now led by South and East Asia. [15]
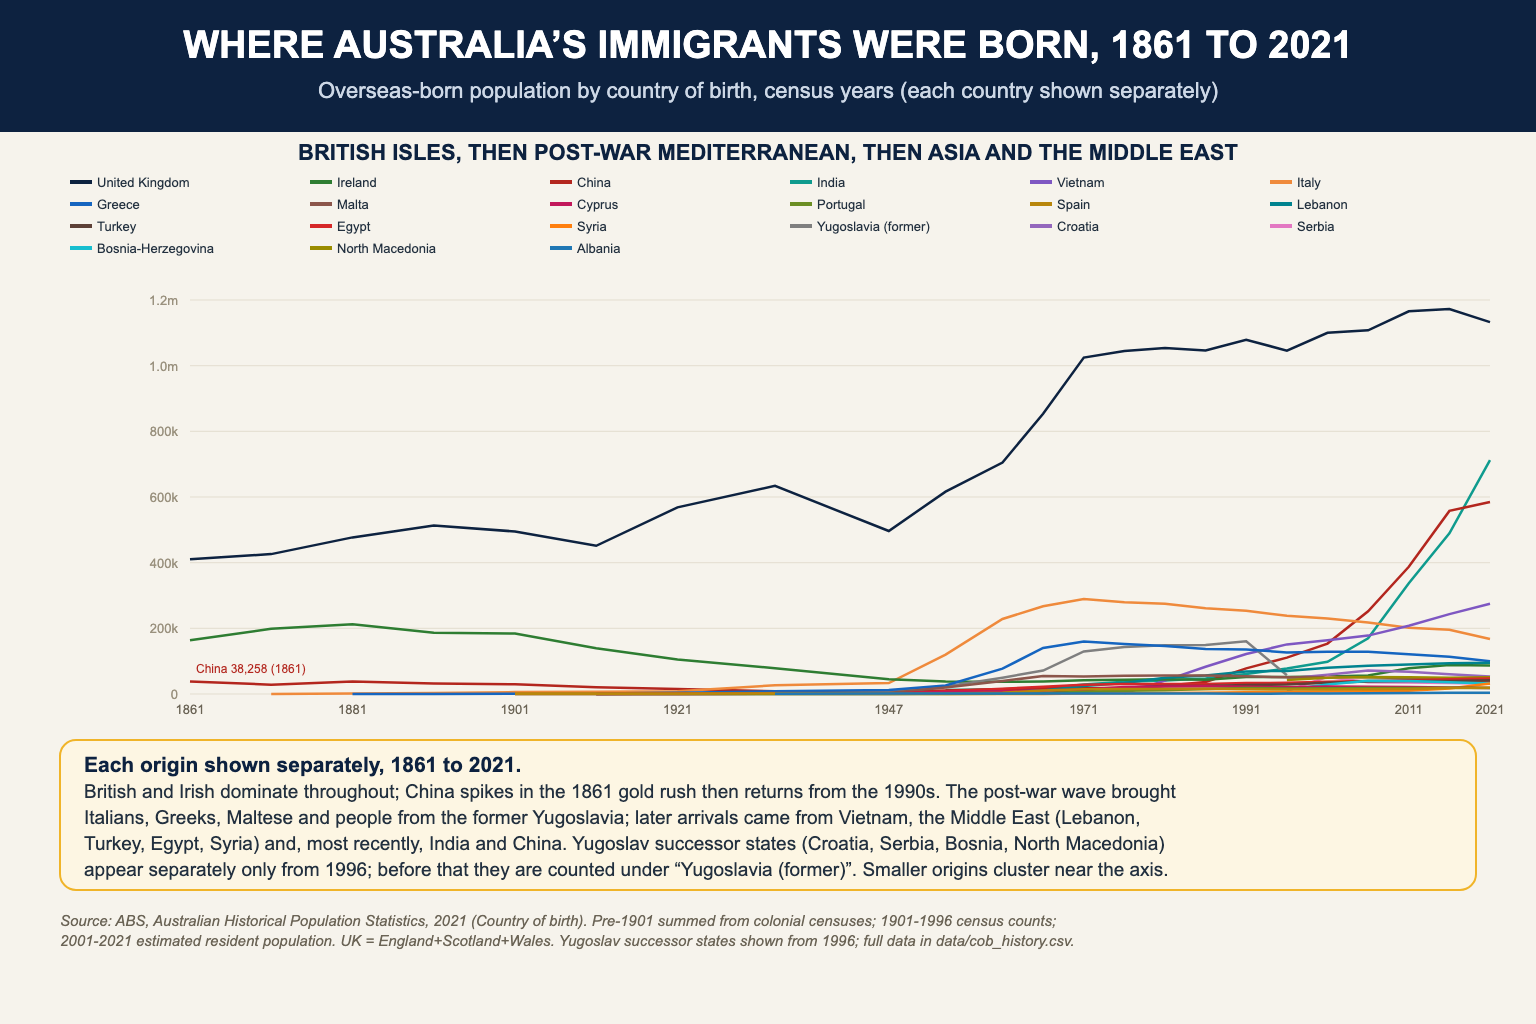
The long view sharpens the point. Counted at each census from the gold rush to today, the origins of Australia's overseas-born have turned over completely. For a century the British and Irish dominated; the great exception was the gold rush, when 38,258 people born in China were recorded in 1861, about 3.3 percent of the population, a figure not matched again until the late 1980s before the White Australia Policy drove it down. Post-war migration then built large Italian, Greek, Maltese and Yugoslav communities, while since the 1990s the fastest growth has come from China and India, the latter now the single largest country of birth. [28]
It is also worth asking what that migration is for. The skilled component of the program is explicitly designed to fill labour shortages, and the occupations it targets are revealing. Of the 185,001 permanent places in the 2024-25 Migration Program, 132,148, about 71 percent, were delivered in the Skill stream. The single largest occupation was registered nurses, with 5,006 places delivered to primary applicants, followed by software and applications programmers (4,221) and chefs (3,439). Accountants (3,250), civil engineering professionals (2,689), ICT business and systems analysts (2,161) and industrial, mechanical and production engineers (2,088) rounded out the upper end, with early childhood teachers (1,507), other engineering professionals (1,352) and motor mechanics (1,324) completing the top ten. Healthcare and teaching are treated as priorities under Ministerial Direction 105, which delivered 10,472 healthcare and 2,798 teaching places to primary applicants in 2024-25. [7]
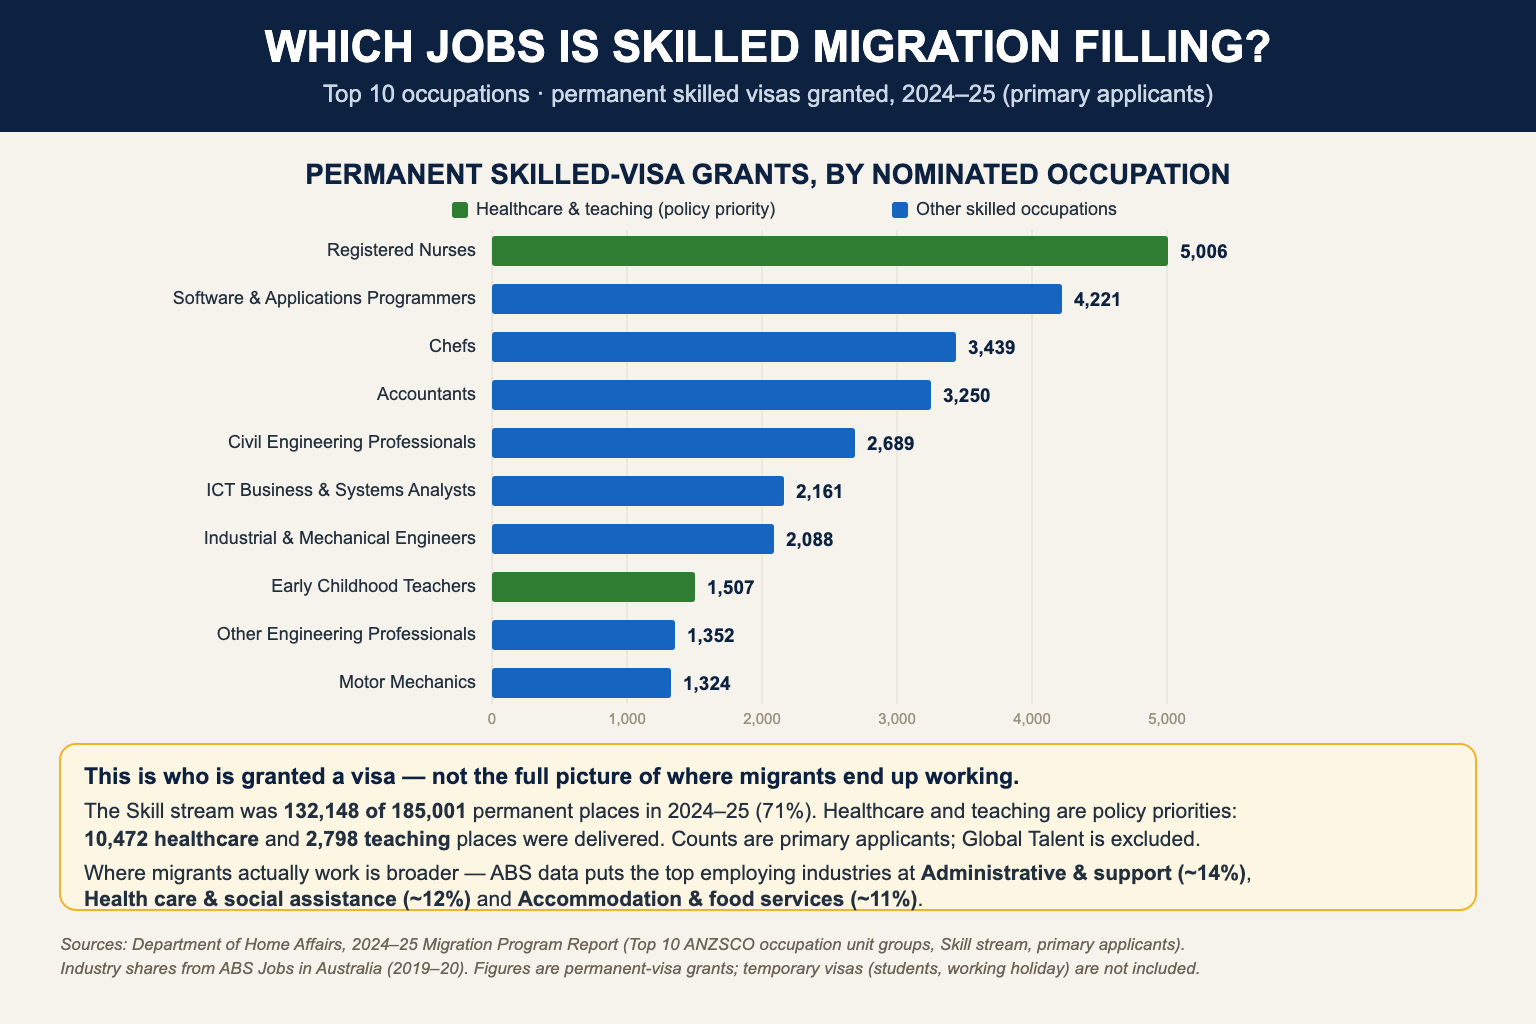
These figures count permanent skilled-visa grants by nominated occupation, not the full picture of where migrants work. Broader ABS data on the migrant workforce shows the largest employing industries are administrative and support services (around 14 percent of migrant jobs), health care and social assistance (about 12 percent) and accommodation and food services (about 11 percent). [8] The skilled intake is also notable for what it says about housing: civil engineers were the fifth-largest occupation overall, while carpenters, architects and electrical engineers feature prominently in the independent and state-nominated categories. [7]
It also helps to be clear about which migrants do that work. Accommodation and food services is an industry rather than a skilled-visa occupation, which is why it never appears among the skilled occupations above even though it employs a large share of migrants. The people staffing cafes, restaurants, hotels and shops are overwhelmingly here on temporary visas, not the permanent skilled program. At 30 September 2025 Australia had roughly 736,000 international students, 239,000 working holiday makers and 218,000 temporary graduates in the country, most with broad work rights, around 1.2 million people in all, against a permanent Skill stream intake of 132,148 places for the whole of 2024-25. The lower-wage, lower-skill end of migrant labour, in other words, runs largely through temporary channels that the debate about the permanent skilled program tends to overlook. [19]
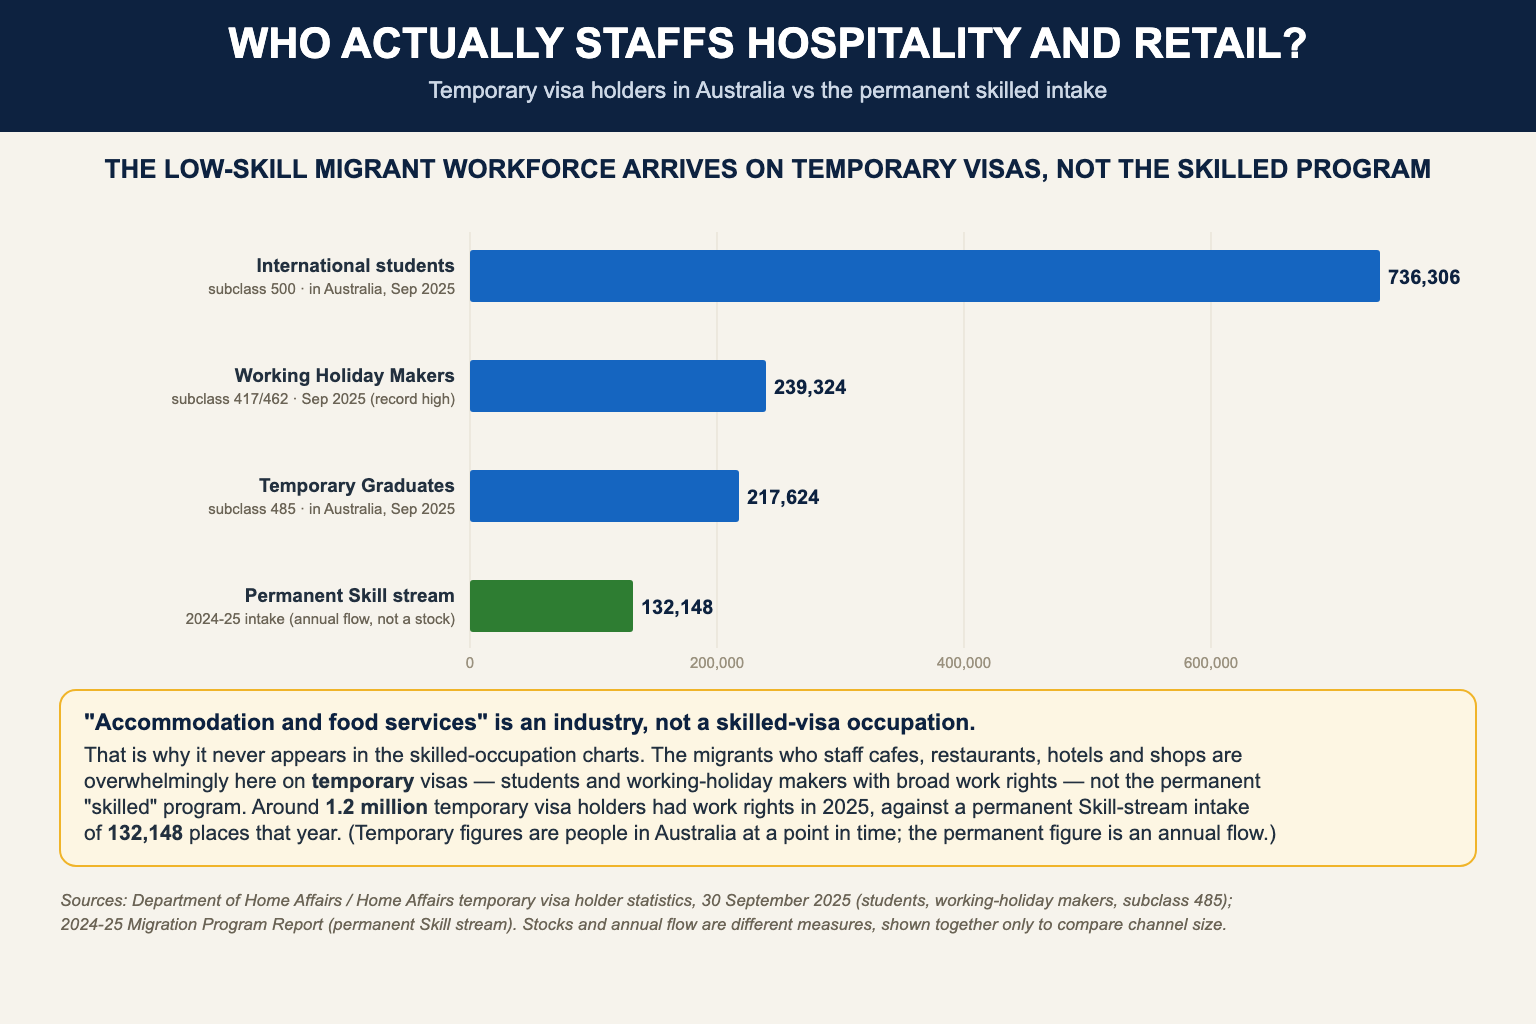
International students deserve a closer look, because they are the largest single component of that temporary labour pool. Student visa holders may work up to 48 hours a fortnight during term, a limit reintroduced on 1 July 2023 after being suspended during the pandemic, and unlimited hours over breaks. [22] The share of international students in paid work rose from about 44 percent before the pandemic to around 61 percent in 2024, with a typical student working roughly 15 hours a week, not far short of the 16 hours worked by the average Australian resident. The Reserve Bank notes that, although students made up only 2 to 3 percent of the labour force before the pandemic, they are now the second-largest group of temporary visa holders with work rights after New Zealanders, and a significant source of labour supply, concentrated in hospitality, retail, aged care and childcare. [21]
That labour is also among the most exploited in the country. In the Migrant Justice Institute's 2019 national survey, around three-quarters of international students were paid below the minimum wage and roughly one in four earned twelve dollars an hour or less, about half the casual minimum; the institute has estimated wage theft from migrant workers at some three billion dollars a year. The students filling these jobs are, in other words, often the victims of the arrangement rather than its beneficiaries, which complicates any simple story about migrants displacing locals: much of this work is offered precisely because it can be had cheaply. [23]
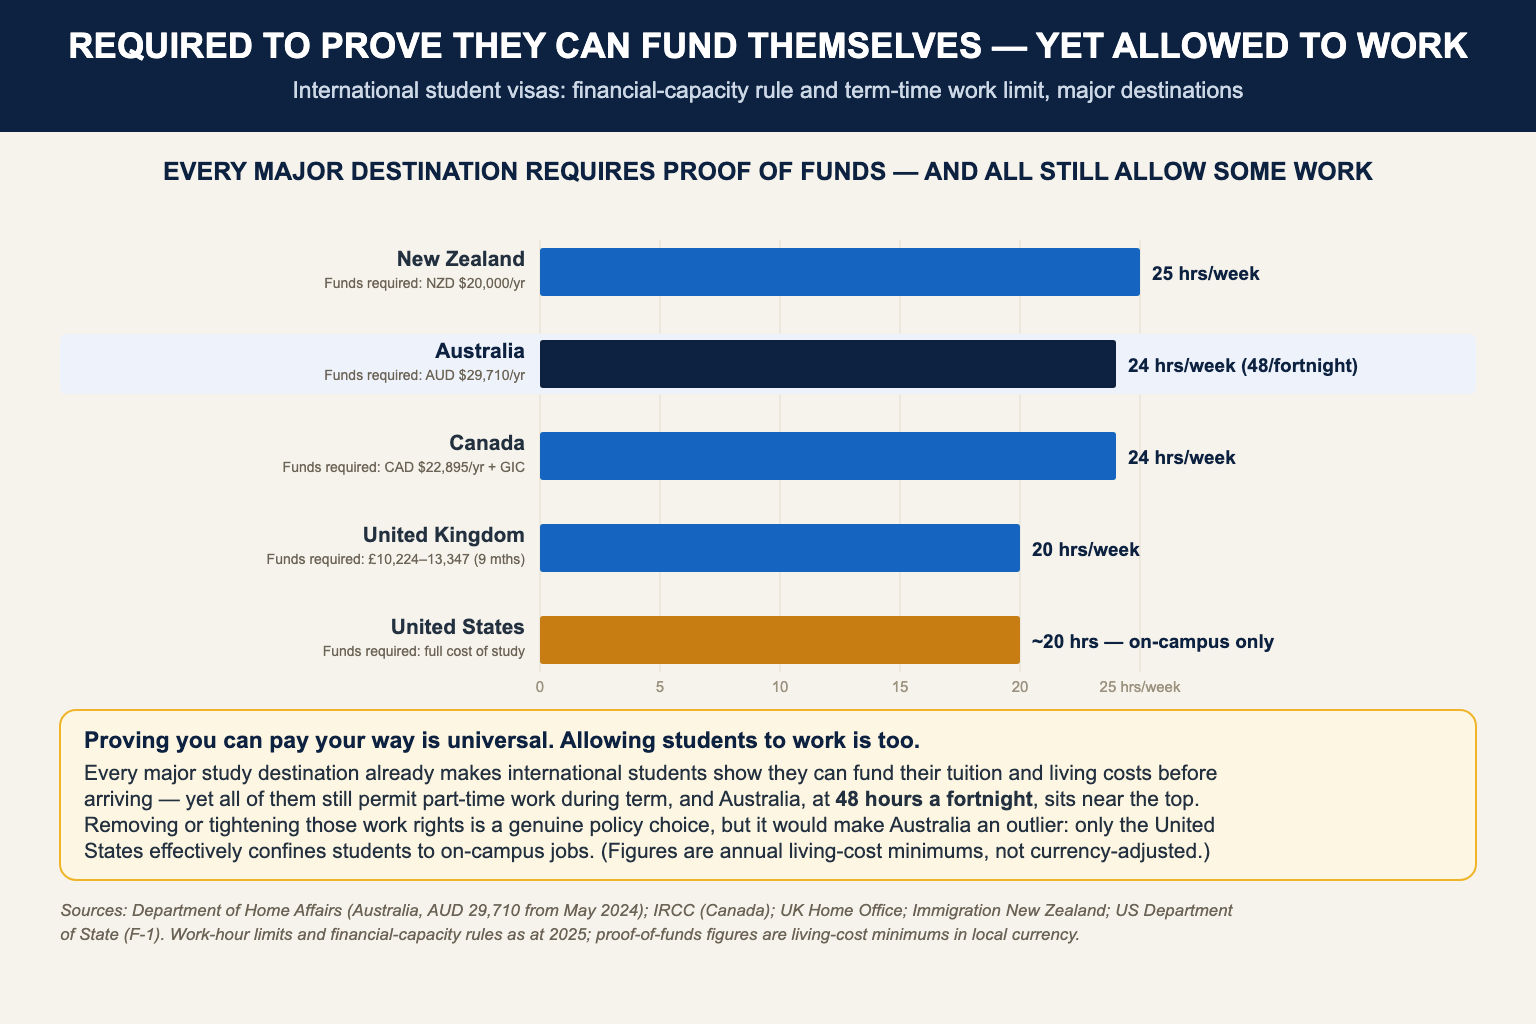
This points to an obvious lever. Australia, like every comparable destination, already requires international students to prove before they arrive that they can fund their tuition and living costs, currently $29,710 a year for living expenses alone. If that test means anything, students should not need to work to support themselves while studying. Yet they may work 48 hours a fortnight, above the United Kingdom and level with Canada, in a labour market where many residents, including some of the migrants already here, are competing for hours. A defensible reform would wind those rights back, on the logic that a student visa is for study and the financial-capacity rule already assumes self-support. The objection, that this would make Australia an outlier since only the United States confines students largely to campus, and that whole sectors now lean on this labour, is real; but that dependence is arguably the problem, not a reason to preserve it. [24]
Skilled occupations can pose the opposite problem to a genuine shortage: importing skills the market has stopped demanding. Software developers are the clearest example. Programmers were the second-largest skilled occupation in the 2024-25 permanent program, with 4,221 places delivered to primary applicants, and ICT business and systems analysts added a further 2,161, with additional numbers arriving on temporary skilled visas. [7] Yet by 2025 the local market for those roles had turned. In its 2025 Occupation Shortage List, Jobs and Skills Australia found that software and applications programmers, assessed as being in shortage every year since the exercise began in 2021, were no longer in shortage in any state or territory, alongside related roles such as developer programmer and ICT quality assurance engineer. [16] Over the same period the technology workforce was shrinking: Department of Industry, Science and Resources figures show a 3.7 percent fall, around 31,000 fewer technology jobs, in the year to May 2025, as firms restructured and AI tools absorbed routine development work, with surveys reporting redundancy fears most acute among technology professionals. [17]
Continuing to bring in thousands of programmers as that market contracts raises a legitimate question about whether every arrival is filling a genuine gap or competing with Australians, including new graduates and the recently retrenched, for a shrinking pool of work. The evidence is not entirely one way. Jobs and Skills Australia also noted a "suitability gap", meaning some employers still struggle to find applicants with the exact experience they want; the federal government retains a target of 1.2 million technology jobs by 2030; and the permanent Skilled Independent stream has already been cut sharply, from 30,375 places in 2023-24 to 16,900 in 2024-25. [7] But the basic tension is real: when an occupation is being declared no longer in shortage and is shedding jobs at the same time as it remains one of the largest categories of skilled arrivals, the case for importing it in volume becomes difficult to defend.
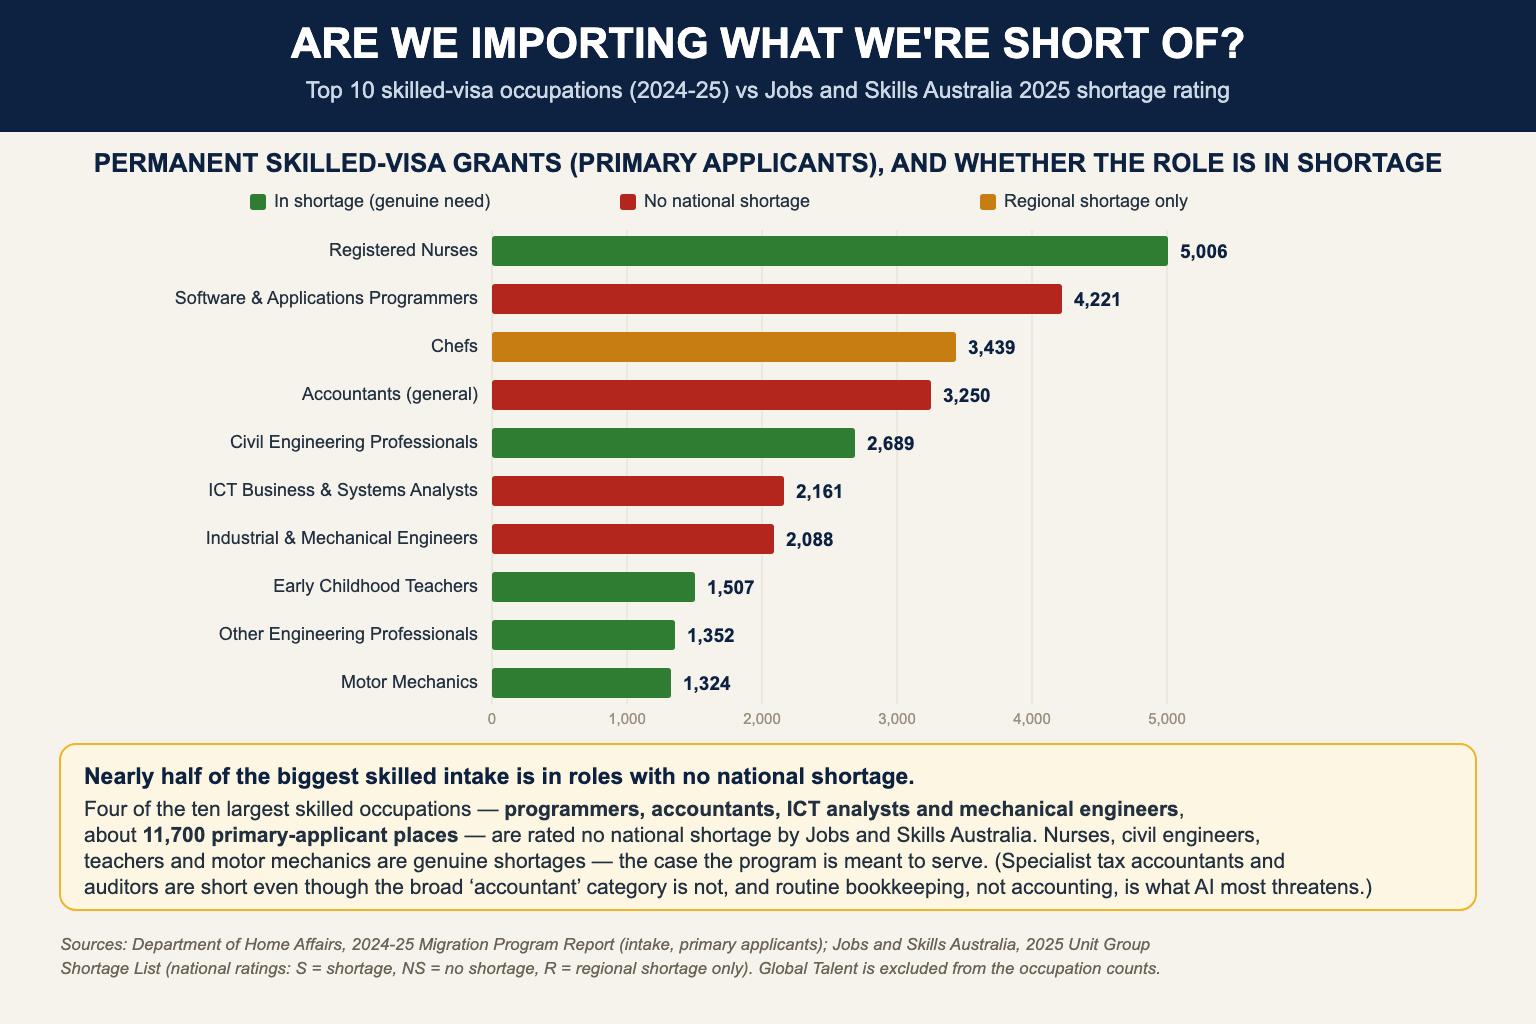
Software is not the only case. Set the 2024-25 intake against Jobs and Skills Australia's 2025 shortage ratings and the pattern recurs across the largest skilled occupations. Of the ten biggest, four, together roughly 11,700 of the primary-applicant places, fall in occupations rated as no national shortage: software and applications programmers, general accountants, ICT business and systems analysts, and industrial, mechanical and production engineers. The other six are closer to the program's purpose: registered nurses, civil engineers, early childhood teachers, other engineers and motor mechanics are all assessed as in shortage, the gap the skilled program exists to fill. Accountants are the most nuanced of the four. Employer bodies report real shortages of specialist tax accountants and auditors and a sharply shrinking domestic pipeline into the profession, yet Jobs and Skills Australia still rates the broad accountant category as no shortage nationally, and it remained the fourth-largest skilled occupation brought in. It is worth adding that the technology most often invoked here, artificial intelligence, falls hardest on routine bookkeeping and clerical work rather than on qualified accountants. The contrast is the point: the program does much of what it is meant to, but a substantial share of the intake still flows into occupations the national labour market is no longer short of. [16][18]
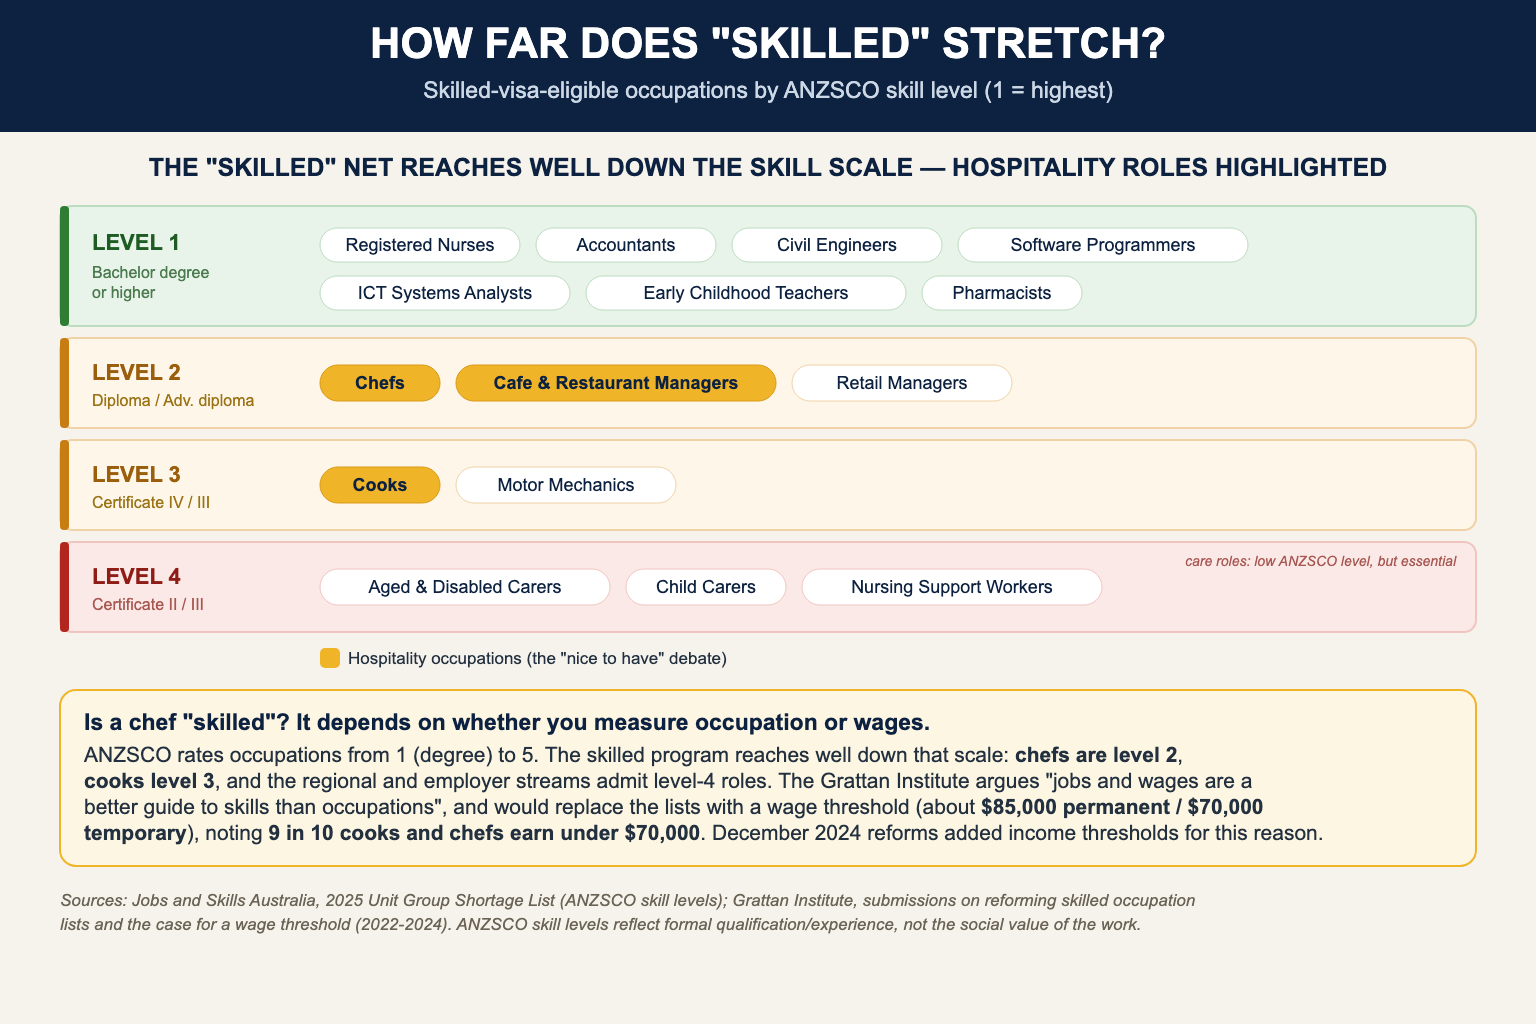
There is a deeper question lurking under all of this: what counts as skilled at all. The ANZSCO classification rates occupations from level 1, requiring a bachelor degree or higher, down to level 5. Most of the largest permanent skilled occupations sit at level 1, but the program reaches well below it. Chefs, the third-largest skilled occupation, are classified at level 2; cooks at level 3; and the regional and employer-sponsored streams admit level-4 roles such as aged and disabled carers. The Grattan Institute has argued for years that "jobs and wages are a better guide to skills than occupations", and has proposed scrapping the occupation lists in favour of a wage threshold, around $85,000 for permanent and $70,000 for temporary visas, pointing out that roughly nine in ten cooks and chefs earn less than $70,000. The December 2024 reforms moved partly in this direction by introducing income thresholds. Whether a chef or a cafe manager should count as a skilled migrant is, ultimately, a judgement about where to draw that line. [16][20]
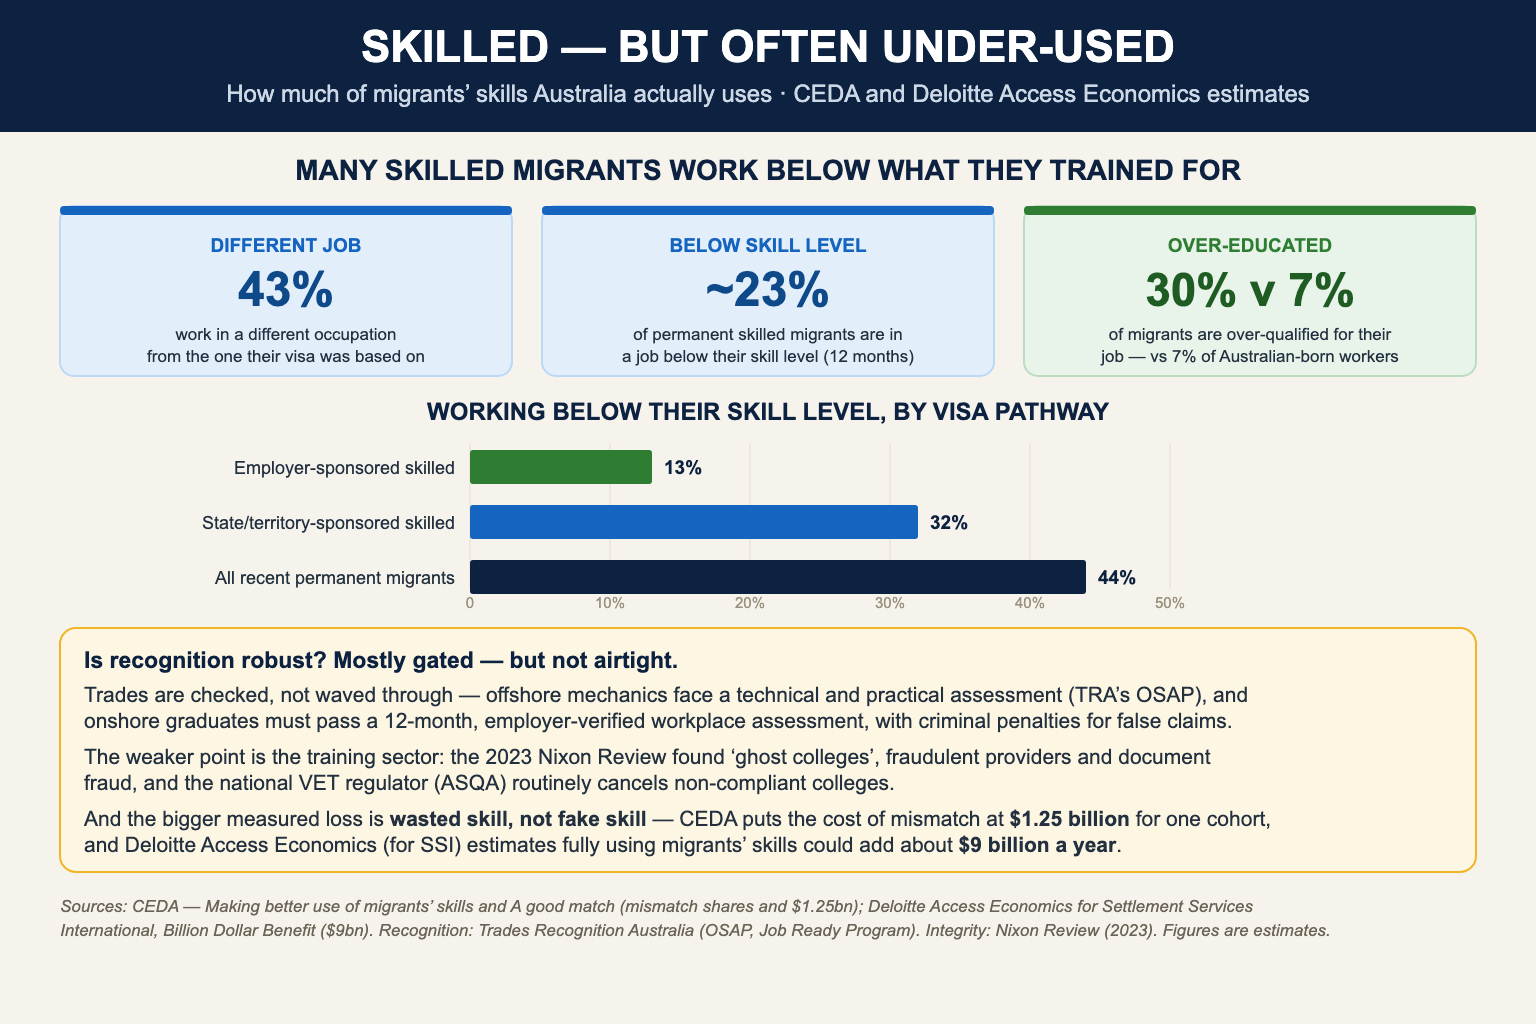
A fair question is how reliably those overseas skills are actually recognised. For trades, the checks are real rather than nominal: an offshore motor mechanic must clear a technical and practical assessment under Trades Recognition Australia's Offshore Skills Assessment Program, [9] while a graduate already in Australia must complete a twelve-month, employer-verified workplace assessment through the Job Ready Program, with criminal penalties for false statements. [10] The recognised weak point lies less in trade assessment than in the education and training sector that feeds parts of the migration system: the 2023 Rapid Review into the Exploitation of Australia's Visa System, conducted by Christine Nixon, found "ghost colleges", fraudulent training providers and document fraud, and the national vocational education regulator routinely cancels non-compliant colleges. [11]
The larger and better-measured problem, however, is the reverse of the one often assumed. Rather than under-qualified migrants slipping through, the evidence points to genuine skills going to waste. The Committee for Economic Development of Australia (CEDA) estimates that around 43 percent of skilled migrants end up working in a different occupation from the one their visa was based on, that roughly 23 percent of permanent skilled migrants are in jobs below their skill level a year after arriving, and that migrants are over-educated for their work at about four times the rate of Australian-born workers. [12][13] CEDA put the cost of this mismatch at some $1.25 billion in forgone wages for one arrival cohort, [12] while separate analysis by Deloitte Access Economics for Settlement Services International has estimated that making fuller use of migrants and refugees skills could add around $9 billion a year to the economy. [14] For a debate centred on housing, the implication cuts a particular way: if the skilled trades and professionals migration brings in, including those needed to build housing, are not always deployed where they are most needed, the country is in a sense paying twice, adding to housing demand while underusing some of the very capacity required to meet it.
It is worth saying plainly what these numbers add up to. When net overseas migration runs at nearly three times natural increase, a country is no longer simply growing; it is being reshaped faster than it can build for. Population growth driven overwhelmingly by migration, rather than by the children of the people already here, is not a neutral statistic to be smoothed over at the margins. On the evidence set out above, it is a serious and largely self-inflicted policy failure.
The damage is not abstract. It is the 90,000-dwelling gap that opened in a single year when migration surged and construction did not. It is the prices and rents a generation of younger Australians can no longer meet. It is the spectacle of a nation importing engineers, carpenters and electricians to build housing while leaving roughly a quarter of its skilled arrivals working beneath their qualifications. Growth of this kind borrows demand from the future and bills it to the present: a birth adds a person the country has two decades to prepare for, whereas a migrant arrival adds a household that needs a home, a GP and a school place now. To let the second so far outrun the first, year after year, without first securing the housing and infrastructure to absorb it, is to quietly accept a lower standard of living for the people already here. This is not an argument against migrants, who are only doing what the system invites them to do; it is an argument against a policy that has treated record intake as a free lunch. Until that intake is brought back into line with the country's capacity to house and serve it, the housing crisis will not ease. It will deepen.
References
[1] Australian Bureau of Statistics, National, state and territory population, September 2025 (released 19 March 2026). https://www.abs.gov.au/statistics/people/population/national-state-and-territory-population/latest-release
[2] Australian Bureau of Statistics, Births, Australia, 2024. https://www.abs.gov.au/statistics/people/population/births-australia/latest-release
[3] Australian Bureau of Statistics, Deaths, Australia, 2024. https://www.abs.gov.au/statistics/people/population/deaths-australia/latest-release
[4] Australian Bureau of Statistics, Census of Population and Housing, 2021 (average household size). https://www.abs.gov.au/census
[5] Australian Bureau of Statistics, Building Activity, Australia (Table 37, Dwelling unit completions), reference period to September 2025. https://www.abs.gov.au/statistics/industry/building-and-construction/building-activity-australia/latest-release
[6] Reserve Bank of Australia, Statement on Monetary Policy (various issues; housing-market commentary). https://www.rba.gov.au/publications/smp/
[7] Department of Home Affairs, 2024-25 Migration Program Report. https://www.homeaffairs.gov.au/research-and-stats/files/report-migration-program-2024-25.pdf
[8] Australian Bureau of Statistics, Jobs in Australia, 2015-16 to 2019-20 (migrant jobs by industry, 2019-20). https://www.abs.gov.au/statistics/labour/jobs/jobs-australia/2015-16-2019-20
[9] Trades Recognition Australia (Department of Employment and Workplace Relations), Offshore Skills Assessment Program (OSAP). https://www.tradesrecognitionaustralia.gov.au/programs/offshore-skills-assessment-program-osap
[10] Trades Recognition Australia, Job Ready Program. https://www.tradesrecognitionaustralia.gov.au/our-programs/job-ready-program
[11] Christine Nixon, Rapid Review into the Exploitation of Australia's Visa System (Department of Home Affairs, 2023). https://www.homeaffairs.gov.au/reports-and-publications/reviews-and-inquiries/departmental-reviews/rapid-review-exploitation-visa-system
[12] Committee for Economic Development of Australia (CEDA), A good match: Optimising Australia's permanent skilled migration (2021). https://www.ceda.com.au/research-and-policy/research/population/a-good-match-optimising-australia-s-permanent-skil
[13] Committee for Economic Development of Australia (CEDA), Making better use of migrants skills (2021). https://www.ceda.com.au/research-and-policy/research/population/making-better-use-of-migrants-skills
[14] Settlement Services International and Deloitte Access Economics, Billion Dollar Benefit: the economic impact of unlocking the skills potential of migrants in Australia (2024). https://www.ssi.org.au
[15] Australian Bureau of Statistics, Australia's population by country of birth, June 2025, and ABS historical population series (proportion of the population born overseas). https://www.abs.gov.au/statistics/people/population/australias-population-country-birth/latest-release
[16] Jobs and Skills Australia, 2025 Occupation Shortage List and 2025 Unit Group Shortage List (4-digit ANZSCO), October 2025. https://www.jobsandskills.gov.au/data/occupation-shortage
[17] Australian Computer Society, "There's no shortage of software engineers in Australia anymore," Information Age (2025), reporting Jobs and Skills Australia and Department of Industry, Science and Resources technology-employment data. https://ia.acs.org.au/article/2025/there-s-no-shortage-of-software-engineers-in-australia-anymore.html
[18] Chartered Accountants Australia and New Zealand (CA ANZ), analysis of accountant shortages and the 2025 Occupation Shortage List (2025). https://www.charteredaccountantsanz.com/news-and-analysis/news/targeted-measures-needed-to-tackle-persistent-accountant-shortages
[19] Department of Home Affairs, temporary visa holders in Australia (international students, working holiday makers, subclass 485), 30 September 2025; and Student visa and Temporary Graduate visa program report, 30 June 2025. https://www.homeaffairs.gov.au/research-and-stats/files/student-temporary-grad-program-report-june-2025.pdf
[20] Grattan Institute, submissions and analysis on reforming skilled occupation lists and adopting a wage threshold for skilled migration (2022-2024). https://grattan.edu.au/news/making-skilled-migration-better-not-just-bigger-should-be-the-priority-at-the-jobs-summit/
[21] Reserve Bank of Australia, "International Students and the Australian Economy," Bulletin, July 2025. https://www.rba.gov.au/publications/bulletin/2025/jul/international-students-and-the-australian-economy.html
[22] Study Australia (Department of Education) / Department of Home Affairs, student visa (subclass 500) work conditions: 48 hours per fortnight, reintroduced 1 July 2023. https://www.studyaustralia.gov.au/en/tools-and-resources/news/work-hours-limit-for-student-visa-holders-to-be-re-introduced
[23] Migrant Justice Institute (B. Farbenblum and L. Berg, UNSW/UTS), International Students and Wage Theft in Australia (2020, based on a 2019 survey) and related migrant-worker wage-theft research. https://www.migrantjustice.org/iswagetheft
[24] Student-visa financial-capacity (proof-of-funds) and work-hour rules across major destinations: Department of Home Affairs (Australia, subclass 500), Immigration Refugees and Citizenship Canada, UK Home Office, Immigration New Zealand, and US Department of State (F-1), 2024-2025. https://immi.homeaffairs.gov.au/visas/getting-a-visa/visa-listing/student-500
[25] Australian Bureau of Statistics, Overseas Migration, 2024-25 financial year (net overseas migration departures by visa group and country of birth). https://www.abs.gov.au/statistics/people/population/overseas-migration/latest-release
[26] Australian Bureau of Statistics, Total Value of Dwellings, March quarter 2026 (median price of established house transfers, unstratified, by capital city and rest of state). https://www.abs.gov.au/statistics/economy/price-indexes-and-inflation/total-value-dwellings/latest-release
[27] City of Greater Geelong (Stats Centre) and CoreLogic, median house price, Greater Geelong (September 2024 quarter). https://www.geelongaustralia.com.au/business/statistics/article/item/8d01ebfdb936404.aspx
[28] Australian Bureau of Statistics, Australian Historical Population Statistics, 2021 (Country of birth; colonial and Commonwealth censuses, and estimated resident population). https://www.abs.gov.au/statistics/people/population/historical-population/latest-release
All URLs accessed 17-18 June 2026.